December 28, there was a lot of activity on 50 MHz. Unexpected winter propagation conditions if you ask me. Here you see the stations that received my 15 Watt FT-8 signal on 50.313 MHz :
Tuesday, 29 December 2020
6 meter activity
Thursday, 10 December 2020
Clockgenerator
The Si5351 clockgenerator needs only 4 wires to connect to the ESP32 DEV board.
Si5351 ESP32
SCL IO22
SDA IO21
GND GND
Vin 3V3
After uploading following Adafruit Si5351 example sketch, the clockgenerator generates 3 squarewaves of different frequencies:
Saturday, 5 December 2020
Si5351
I found this nice gadget. It is a signal generator and contains a Si5351 integrated circuit. Should be able to deliver signals in the range from 8 kHz till 160 MHz.
Hope to get it working with the ESP32 module.
Friday, 13 November 2020
ESP32 Simple Wifi server
I am exploring the Wifi possibilities of the ESP32 module.
I found a sketch that enables you to switch on/off a LED via the module through an internet browser. I selected pin 2 as output, since this pin is connected to the internal blue LED of the module.
The sketch includes the 'wifi.h' subroutine that sets up a steady wifi link to your local network.
I adapted the sketch and included two counters that shows you the number of switch on/off actions in your browser.
So now I have two-direction data traffic from the ESP32 mini wifi server to the internet browser. It works fine.
Part of the sketch:
This is how it looks like in the browser:
I am impressed by the Wifi capabilities of the small 3$ device.
Update 21 Nov 2020;
I added this Wifi functionality to the CO2 analyser (see also blog 4 Nov 2020).
Wednesday, 4 November 2020
ESP32 lessons
Past days I learned a lot about the ESP32 microcontroller. Internet taught me how to connect an LCD to the controller and how to read analog inputs.
I installed the Arduino IDE with the Espressif files to be able to program the ESP32 development kit in "C".
At this moment I have a working prototype of a CO2 sensor circuit. I used an MG-812, CO2 sensor.
This is how the setup looks now:
CO2 sensor setup
The circuit consists of an analogue and digital part:
CO2 sensor analogue circuit with 10x gain opamp
CO2 sensor digital circuit
This is my first program in "C":
It was an interesting voyage to get the module in action. Lots of features are there to be discovered; wifi and bluetooth function, I2C protocol, PWM outputs etc.
Notes;
-The electrolytic capacitor of 10 uF between EN and GND on the ESP32 module was necessary to upload the program to the module. It took me a couple of days to find that out.
-The max input voltage of the ADC inputs is 3.3 V. That's why I installed a 3V3 zenerdiode after the output of the opamp.
Update 21 Nov 2020:
I added the wifi functionality to the software. I can read out the CO2 concentration via the internet:
Also placed the ESP32 module onto the board:
Updated 5 Dec 2020;
Sunday, 25 October 2020
Internet of Things
I read some interesting stories about the IoT lately. The ESP32 development board turns out to be good starting point to do some experiments with Wifi, Bluetooth etc.
I ordered a couple of this interesting, low priced, devices.
Time to get familiair with the Arduino IDE and the C programming language.
Saturday, 17 October 2020
73 from St. Petersburg
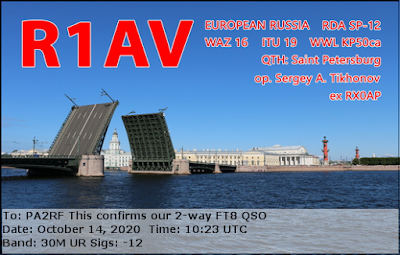
Last wednesday, I made some HF FT-8 contacts. The QSO with Sergey, R1AV was one of them:
Off topic:
Wednesday, 23 September 2020
Magnetic Loop Antenna Controller
With Gerard, PA2G I am working on a magnetic loop antenna.
I have started with the Magnetic Loop Controller. The design of the controller is from Loftur, TF3LJ / VE2LJX.
https://sites.google.com/site/lofturj/to-automatically-tune-a-magnetic-loop-antenna
Frederik, ON5AI provides nice DIY-kits for this design
The hart of the circuit is a Teensy3.2 controller. I am using a steppermotor 17HS4401, which will drive the Vacuum-C of the antenna configuration.
There will be some interesting challenges: housing of the SWR-pcb, housing of the controller, interface with the HF radio, etc.
Thursday, 17 September 2020
Casedemic, data against hysteria
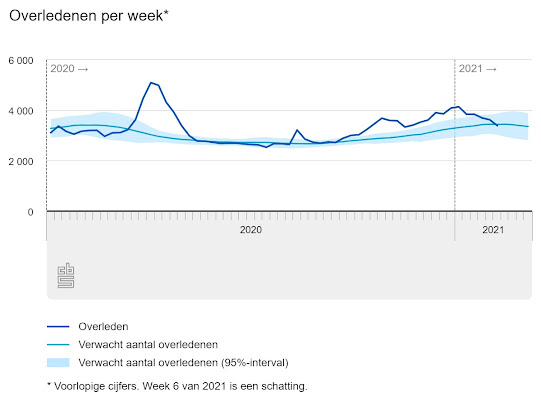
If you are interested in the science, statistics, graphs and numbers describing Covid-19, this video presentation of Ivor Cummins may be interesting for you:
His message: Be aware of Casedemic Hysteria
Update 14-Nov-2020:
Sunday, 6 September 2020
PI7CIS beacon
PI7CIS is a 2 meter / 70 cm beacon with QTH locator JO22dc (Scheveningen). The distance to my QTH is appr. 60 km.
It transmits CW signals on 144.416 MHz (45 W) and 432.416 MHz (75 W). Antenna height is 42 meters ASL. More info: http://www.pa0c.nl/Pi7cis/pi7cis_vhf_beacon.htm
I was looking for a steady 70 cm signal for experimenting and improving the stability of my 28 - 432 MHz transverter and found PI7CIS. I am trying to improve the transverter's 404 MHz oscillator stability. This oscillator is not temperature compensated (TCXO or OCXO). With a small resistor-heated heatsink on top of the oscillator I try to improve the short term stablity.
70 cm beacon on screen
Monday, 24 August 2020
Audio-video website
I added a new website to 'nice web links'. It was recently launched by my son Johnno. He is an audio-video equipment product specialist.
Visit his website (Dutch only) here: https://www.audiobeeld.nl
Thursday, 20 August 2020
144 MHz FT-8 activity
Yesterday, I noticed good FT-8 activity around 144.176 MHz.
I used my logper antenna and picked up signals from UK, ON, F and D.
Sunday, 19 July 2020
Fieldstrength meter
This meter uses a quadrupler circuit to increase sensitivity:
The Ge-diodes (OA85) make the meter useable even above 500 MHz.
Friday, 17 July 2020
nanoVNA
Ordered a nanoVNA that arrived yesterday.
I was able to do my first antenna analysis after looking at some youtube movies.
Here you can see a homebrewed 2 m antenna under test. A nice dip exactly on 144 MHz in the attenuation trace. The Smith chart shows almost a 50 ohms impedance (the green triangle near the centre).
It is an impressive toy for a few bucks (aliexpress, amazon). It enables you to analyse antennas, filters etc. from 50 kHz - 900 MHz !
Wednesday, 15 July 2020
No decrease in global CO2 concentration during the early COVID-19 era
Around 1960 the CO2 concentration was about 315 ppm (parts per million). In 2020 the concentration has increased to a level of about 415 ppm. Generally, it is believed that this CO2 increase is caused by anthropogenic emissions ('human caused' emissions) and is the main reason for global warming.
Note: the 'sawtooth' pattern you see is caused by seasonal influences (the presence and absence of the green parts of trees/vegetation).
Since the start of the COVID-19 pandemic, the CO2 emissions from the burning of fossil fuels have dropped dramatically. It is estimated that the global CO2 emissions dropped with an average of 17% starting April 2020. Peaks of around 26% have also been noticed.
However, in the most recent graphs we do not see a decline in CO2 concentrations at all:
Fig. 2 Last 2 years
CO2 is a so called well mixed gas that spreads within a few weeks in the atmosphere. But even after a couple of months after the start of the corona wave, we do not see major changes in the Mauna Loa CO2 concentration trend.
Other global CO2 monitoring laboratories show the same behaviour as the Mauna Loa laboratory with respect to CO2 concentration.
One can consult the Mauna Loa data here:
https://www.esrl.noaa.gov/gmd/ccgg/trends/graph.html
This might be a good time to adjust the CO2-prediction models based upon the data gathered in the early corona period. The contribution of anthropogenic CO2 emissions to natural CO2 emissions might be far less then we thought. Administrations should be more reluctant with spending trillions on projects that might reduce CO2 emissions.
The most common greenhouse gas is water (water vapor/clouds). The effect of water as a greenhouse gas might be underestimated; Although the GWP ('global warming potential') of CO2 is much higher than that of H2O, the presence in the earth's atmosphere of CO2 (0.038%) is so much smaller than that of H2O (0.5%..7%) .


