Sunday, 25 October 2020

Internet of Things

I read some interesting stories about the IoT lately. The ESP32 development board turns out to be good starting point to do some experiments with Wifi, Bluetooth etc.

I ordered a couple of this interesting, low priced, devices.

Time to get familiair with the Arduino IDE and the C programming language.


Off topic:

Krammerdam, 8-nov-2020


Krammer, January 2021


Saturday, 17 October 2020

73 from St. Petersburg

Last wednesday, I made some HF FT-8 contacts. The QSO with Sergey, R1AV was one of them:


Off topic:


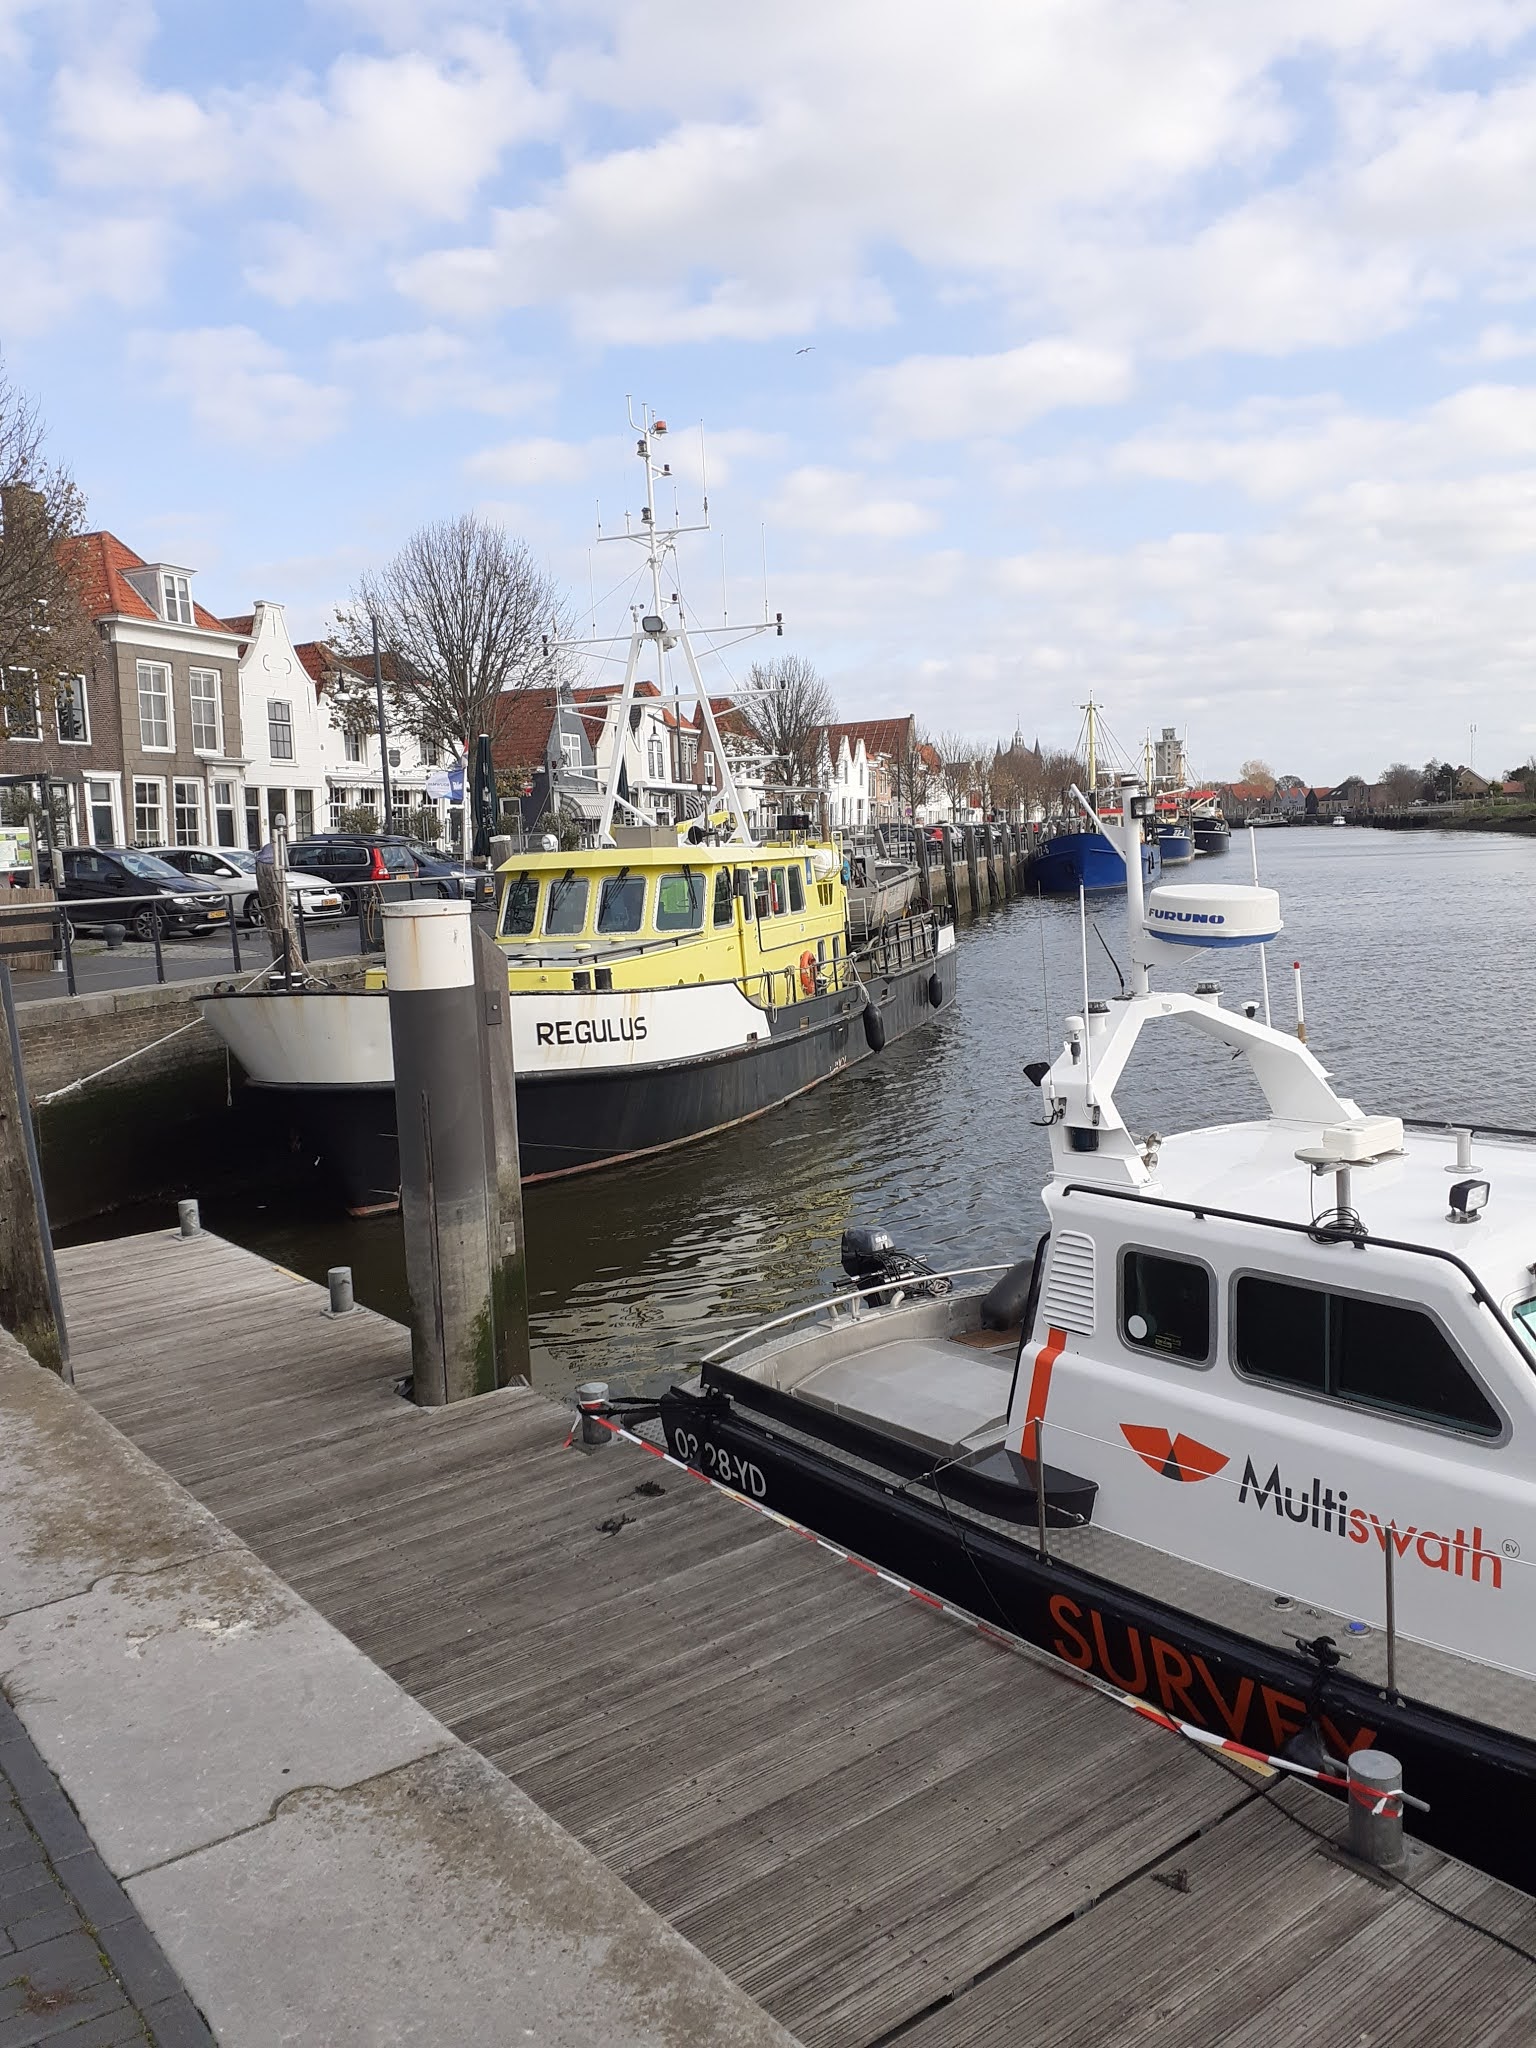
Outer port Zierikzee


Echt Judasoor, Ooltgensplaat

cloud ear fungus
Auricularia auricula-judae


Wednesday, 23 September 2020

Magnetic Loop Antenna Controller

With Gerard, PA2G I am working on a magnetic loop antenna.

I have started with the Magnetic Loop Controller. The design of the controller is from Loftur, TF3LJ / VE2LJX.

https://sites.google.com/site/lofturj/to-automatically-tune-a-magnetic-loop-antenna

Frederik, ON5AI provides nice DIY-kits for this design

https://en.golb.be/


The hart of the circuit is a Teensy3.2 controller. I am using a steppermotor 17HS4401, which will drive the Vacuum-C of the antenna configuration.

There will be some interesting challenges: housing of the SWR-pcb, housing of the controller, interface with the HF radio, etc.


Magnetic Loop Antenna Controller


4 x 20 character display

Status Oct. 4, 2020:


Thursday, 17 September 2020

Casedemic, data against hysteria

 If you are interested in the science, statistics, graphs and numbers describing Covid-19, this video presentation of Ivor Cummins may be interesting for you:

https://youtu.be/8UvFhIFzaac

His message: Be aware of Casedemic Hysteria


Update 14-Nov-2020:


There is a second bump this autumn in The Netherlands, but not a second 'wave' as often stated by the mainstream media.

December 14, it was decided that The Netherlands go into a hard lockdown until January 19, 2021. I believe that lockdowns are not supported by science and data, gathered the last decennia, and the benefit of the measure will be very limited. But that is just an opinion.

Update 28-Jan-2021


The so called second wave still does not look like a wave to me. The hard lockdown in The Netherlands has been extended to somewhere in March. Leaving the house after 21.00 hr. is forbidden. The average age of people passed away in The Netherlands because of Covid-19 is 83. There are no deaths because of influenza anymore.


Update: 19 Feb 2021: In spite of the fact that the mortality rate in The Netherlands is as expected, the hard lockdown continues till at least end March.

Update: 4 June 2021: Mortality rate is less than expected. Masks still mandatory. No more deaths because of influenza. 10 million people received their (at least first) vaccin. Graph  end May/begin June 2020 (no vaccins) shows identical values as end May/begin June 2021. Seasonal effect rules.


Sunday, 6 September 2020

PI7CIS beacon

PI7CIS is a 2 meter / 70 cm beacon with QTH locator JO22dc (Scheveningen). The distance to my QTH is appr. 60 km.

                                                        PI7CIS

It transmits CW signals on 144.416 MHz (45 W) and 432.416 MHz (75 W). Antenna height is 42 meters ASL. More info: http://www.pa0c.nl/Pi7cis/pi7cis_vhf_beacon.htm


I was looking for a steady 70 cm signal for experimenting and improving the stability of my 28 - 432 MHz transverter and found PI7CIS. I am trying to improve the transverter's 404 MHz oscillator stability. This oscillator is not temperature compensated (TCXO or OCXO). With a small resistor-heated heatsink on top of the oscillator I try to improve the short term stablity.


                                                70 cm beacon on screen

Monday, 24 August 2020

Audio-video website

I added a new website to 'nice web links'. It was recently launched by my son Johnno. He is an audio-video equipment product specialist.

Visit his website (Dutch only) here: https://www.audiobeeld.nl


Thursday, 20 August 2020

144 MHz FT-8 activity

Yesterday, I noticed good FT-8 activity around 144.176 MHz.

I used my logper antenna and picked up signals from UK, ON, F and D.


Off topic;


Sunday, 19 July 2020

Fieldstrength meter

I replaced an insensitive VU meter by a 100 uA meter on my fieldstrength meter:


This meter uses a quadrupler circuit to increase sensitivity:


The Ge-diodes (OA85) make the meter useable even above 500 MHz.
Later, instead of the OA85's, I installed BAT85 Schottky diodes to increase the sensitivity.

Off topic:

Tholen, 8 Nov 2020


Friday, 17 July 2020

nanoVNA

I just couldn't resist.

Ordered a nanoVNA that arrived yesterday.

I was able to do my first antenna analysis after looking at some youtube movies.


Here you can see a homebrewed 2 m antenna under test. A nice dip exactly on 144 MHz in the attenuation trace. The Smith chart shows almost a 50 ohms impedance (the green triangle near the centre).

It is an impressive toy for a few bucks (aliexpress, amazon). It enables you to analyse antennas, filters etc. from 50 kHz - 900 MHz !


Wednesday, 15 July 2020

No decrease in global CO2 concentration during the early COVID-19 era

At Mauna Loa, Hawaii, since 1960, the CO2 concentration is measured. 

Around 1960 the CO2 concentration was about 315 ppm (parts per million). In 2020 the concentration has increased to a level of about 415 ppm. Generally, it is believed that this CO2 increase is caused by anthropogenic emissions ('human caused' emissions) and is the main reason for global warming.


Fig 1 CO2 concentration at Mauna Loa, 1960-2020

Note: the 'sawtooth' pattern you see is caused by seasonal influences (the presence and absence of the green parts of trees/vegetation).

Since the start of the COVID-19 pandemic, the CO2 emissions from the burning of fossil fuels have dropped dramatically. It is estimated that the global CO2 emissions dropped with an average of 17% starting April 2020. Peaks of around 26% have also been noticed.
However, in the most recent graphs we do not see a decline in CO2 concentrations at all:


Fig. 2 Last 2 years

CO2 is a so called well mixed gas that spreads within a few weeks in the atmosphere. But even after a couple of months after the start of the corona wave, we do not see major changes in the Mauna Loa CO2 concentration trend.

Other global CO2 monitoring laboratories show the same behaviour as the Mauna Loa laboratory with respect to CO2 concentration.

One can consult the Mauna Loa data here:

https://www.esrl.noaa.gov/gmd/ccgg/trends/graph.html

This might be a good time to adjust the CO2-prediction models based upon the data gathered in the early corona period. The contribution of anthropogenic CO2 emissions to natural CO2 emissions might be far less then we thought. Administrations should be more reluctant with spending trillions on projects that might reduce CO2 emissions.
The most common greenhouse gas is water (water vapor/clouds). The effect of water as a greenhouse gas might be underestimated; Although the GWP ('global warming potential') of CO2 is much higher than that of H2O, the presence in the earth's atmosphere of CO2 (0.038%) is so much smaller than that of H2O (0.5%..7%) .